¶ Overview
BIAD is a relational database with the primary objective of organizing data with respect to human cultural activity. Crucial to BIAD is the need for intelligent decisions by the data team to aggregate raw data at a meaningful level. Therefore BIAD is not a repository for datasets with variety of structures. At the top of the relational hierarchy sits sites. Below this phases represent discrete temporal ‘layers’ of human activity associated with a specific cultural unit. These phases are associated with a specific culture group, but in rare cases only with a broad period. The concept of the phase is central to BIAD, despite the difficulties in codifying a precise definition. Most sites have only a single phase. Many have several, each assigned a different culture group. A few sites have multiple phases assigned to different periods of the same culture group, since the data differences between these phases were too important to warrant aggregation. Therefore all data in BIAD sits in a phase, with the single exception of some radiocarbon dates that can only be associated with a site.
¶ Standard Tables
The bulk of the data in BIAD are spread across the standard tables.
¶ zoptions Tables
These are look-up tables or options tables (the 'z' preface is a convenience when listing tables alphabetically) to constrain various values that can be entered into the main standard tables. Many columns on the standard tables are enumerated (for example 'yes' or 'no'), but it is often more convenient for longer options lists to provide a specific zoptions table instead. Typically these tables have very few (often only one) column.
¶ Templates
In order to prepare a .csv data table for batch import into a BIAD table it is crucial to ensure the correct columns. This can be easily achieved by either downloading an empty version of the relevant table directly from BIAD, or alternatively by downloading from the templates list below which includes a single sample row to assist. Note this sample row is a deliberate combination of real and toy data. The template tables are .csv format. Care must be taken to ensure UTF-8 encoding is used when editing in a spreadsheet program (such as excel). One advantage of downloading a template .csv is that these have been saved with a Byte Order Mark (BOM) so your spreadsheet editing program will automatically recognise and save the file using UTF-8.
¶ Relationships
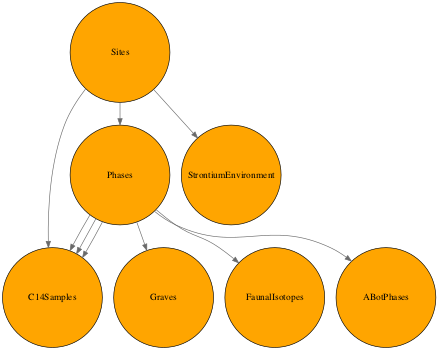
The complete horredogram representation of relationships between all the main tables is complex:

Instead the structure may be more easily understood by separating the overall database into small groupings or clades:
¶ Phases
Fundamental to BIAD is the tricky concept of a phase. Phases are discrete 'space-time' blobs of data. The 'space' component is more easily defined as the latitude and longitude coordinates of the archaeological site (although even defining the point at which a series of pits can be considered a single site or several sites is itself a moot issue). Phases therefore, are discrete temporal aggregations at a site, loosely related to stratigraphic layers. Most sites will only have a single phase, and it is rare indeed to have more than a hanful of phases. As a minimum, phases should have a period assigned, and usually a cultural assignment and reported (published) date ranges.
The assignment of a phase is usually the most time consuming component of datamining source publications into BIAD, and requires careful expert interpretation of the primary source. Furthermore, these assignments are subject to change as new data is added to BIAD.
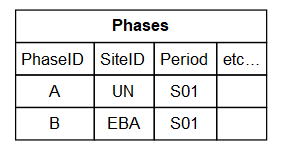
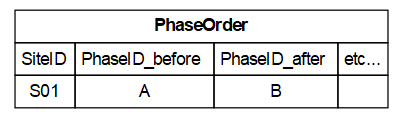
For a simple example, consider inputting data from a site report that describes material from an early phase during the Early Bronze Age (EBA), and more material from a clearly later phase (stratographically distinct) established as from the Early Neolithic (EN). We can add the phase-specific data to the Phases table, and trivially assign this known order to the PhaseOrder table:
Consider the more challenging is the case where different site reports provide different data at different temporal scales. Consider for example the plot below illustrating a site report providing Faunal data (blue) for three phases, whilst a different report provides Botanical data (red) for two phases:
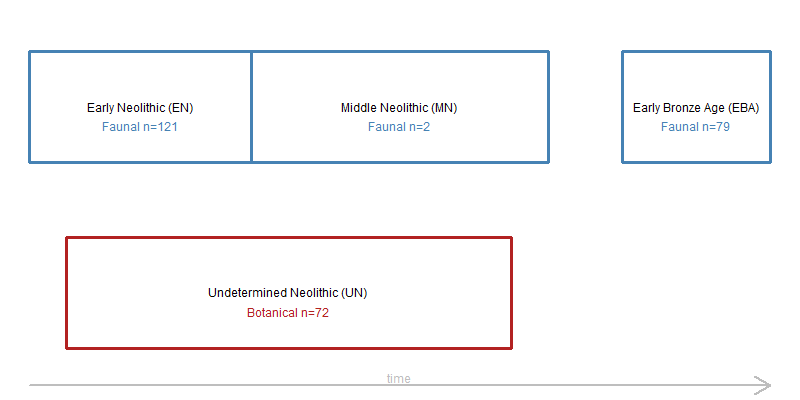
Crucially, the phasing of the two reports are incongruent, and in order to store data in a way that maximises its usefulness we must make a decision of how best to adapt it. Since the sample size of the Faunal data during the MN is so small (n=2), the information content is poor, and the data are more useful if we amalgamate both the EN and MN into a single UN phase:
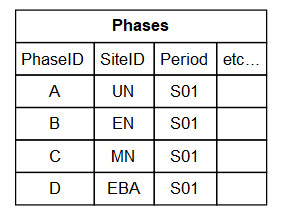
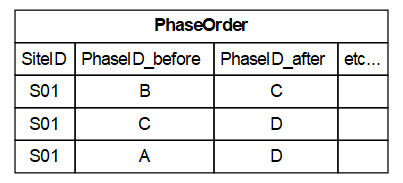
In contrast,consider the plot below illustrating a similar incongruence between two reports, but where there sample sizes are such that we cannot justify such amalgamations. Furthermore, We know that the EN, MN and EBA phases are ordered, we also know the UN and EBA phases are ordered, but we have no idea about the relative chronology between EN and UN, or between MN and UN:

In such a case, we store the ordering as follows:
¶ Harmonising
A crucial part of adding any new data to BIAD is to first establish if they are already stored. For some data types it is impossible to accidentally import duplicates, for example 14C labcodes are a unique column. However, checking if a site or phase already exists is a non-trivial task and may require substantial human effort. For example, it is possible for two completely different sites to have been independently published with the same site name. Or, for the same site to have been excavated (and therefore published) twice, but with slightly different latitude and longitude coordinates (perhaps due to inaccuracies).
In such cases where there are slightly different data (such as coordinates) for what are clearly the same site or phase, the analyst must harmonise these data. This involves making a decision about how best to combine them. An easy example might be the case where one dataset derived its coordinates using the nearest village on a map rounded to 1dp, whilst the other provided 3dp precision from a satellite measurement on site.
Even more frustratingly, in rare cases a single site spanning several hundred metres may be published with one pair of coordinates, but subsequent exavation of the same site consider several pits as different sites, each with slightly different coordinates. This is not a huge problem per se, as downstream macro analysis will typically be looking at patterns across a broader area, so we can retain both data sources without needing to harmonize both.
However, a single data point (such as a 14C date) obviously cannot belong to two different sites, so as a general rule of thumb we should favour the more detailed or later publication.